As far back as ancient Egypt, the servants of the pharaohs tempered the heat and kept their masters comfortable by stirring the air with large fans called flabellums[i]. Around 500 BC, the Indians invented the first ceiling fans, originally designed with bird wings. It wasn’t until 1882, and the American inventor Philip Diehl, that electric ceiling fans were finally available. For a very long time after this invention, the question of saving energy remained a secondary issue. As long as you had air movement and felt better, it didn’t matter how much electricity you consumed. Little by little, ceilings in tropical and equatorial zones are being fitted with air fans. But temperate zones continue to prefer air conditioning for a long time to come.
The precursors of objective summer comfort: Woods and Givoni Guide
However, architects and engineers were quick to recognise the usefulness of ceiling fans, even in temperate zones.
As early as 1952, two Anglo-Saxon authors, W.C. Osborne and C.G. Turner, published a reference guide, the « Woods Practical Guide to Fan Engineering » [ii]) which uses a simple, operational formula to relate air speed and perceived temperature.
The diagram below is based on this work, and applies to the summer period under average humidity and clothing conditions:
Here is the result:
| Air speed (m/s) | Equivalent cooling (°C) |
|---|---|
| 0,00 | 0,0 |
| 0,15 | 0,5 |
| 0,30 | 1,0 |
| 0,50 | 1,5 |
| 0,70 | 2,0 |
| 0,85 | 2,5 |
| 1,00 | 3,0 |
Figure 1 – diagram taken from the Woods Ventilation Guide
It should be noted that the question of humidity is not necessarily crucial, with a few exceptions, in temperate zones. In fact, in these climatic zones, the degree of humidity remains relatively low overall during the summer season. Nevertheless, it was architect Baruch Givoni’s famous bioclimatic diagram[iii] that became popular with building designers in the mid-1970s. This graph shows that summer comfort zones widen as air speed increases. Since the first oil crisis, energy savings have become a major focus of interest. Bioclimatism has come out of its isolation, and is no longer just the preserve of activists.
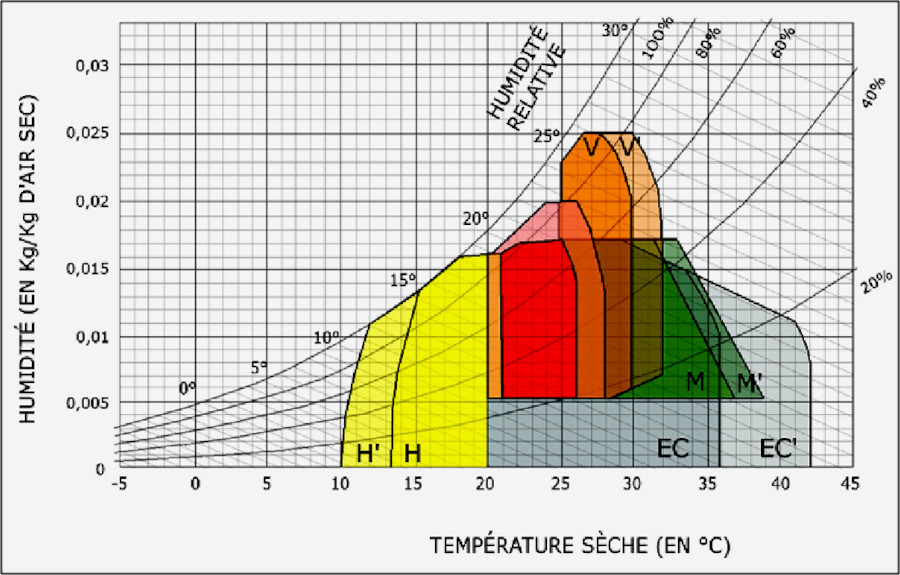
Figure 2 : Bioclimatic diagram of the building: zones V and V’ show the beneficial impact of air speed (see notes for details[iv])
In the 2000s, the Tribu design office created a very explicit version of the Givoni diagram, focusing more on air velocity. It’s a tool that facilitates a highly constructive dialogue with clients, and is incorporated into some dynamic thermal simulation (DTS) software.
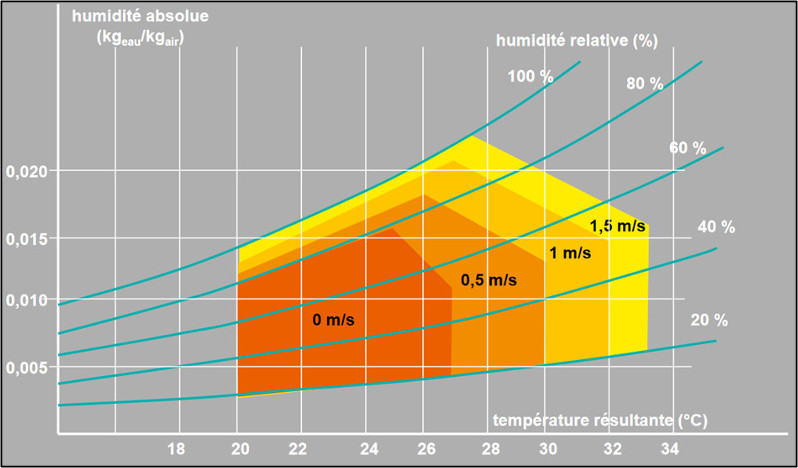
Figure 3 : the Givoni diagram reviewed by Tribu
The PMV/PPD method: we are not all equal when it comes to heat
The previous approaches have the merit of being clear. However, they lack an essential dimension. We don’t all react in the same way to heat. Whether we are male or female, thin or strong, young or old, our personal, physical, cultural or psychological characteristics all play a part in our perception of heat and discomfort. With this in mind, a new approach emerged in the 1970s, based on survey techniques: the Fanger or PMV/PPD model. This approach was originally developed with a view to workplace performance: if employees are too hot, they lose productivity. The aim of this model is not to achieve 100% satisfaction, but to ensure that there are as few dissatisfied people as possible. The aim is therefore to achieve a dissatisfaction rate of less than 10%. Two values are linked together:
- PMV (Predicted Mean Vote), which simulates the average vote of a large group of people [v] on a 7-level scale of thermal sensation ranging from +3 (very hot) to -3 (very cold). This index is based on the human heat balance equation. In particular, it takes into account metabolism, clothing, air temperature, heat radiation, air speed, etc.
- PPD (Predicted Percentage of Dissatisfied) quantitatively predicts the percentage of people who are dissatisfied because they find the thermal environment too hot or too cold and who would vote +3, +2, -2, -3…
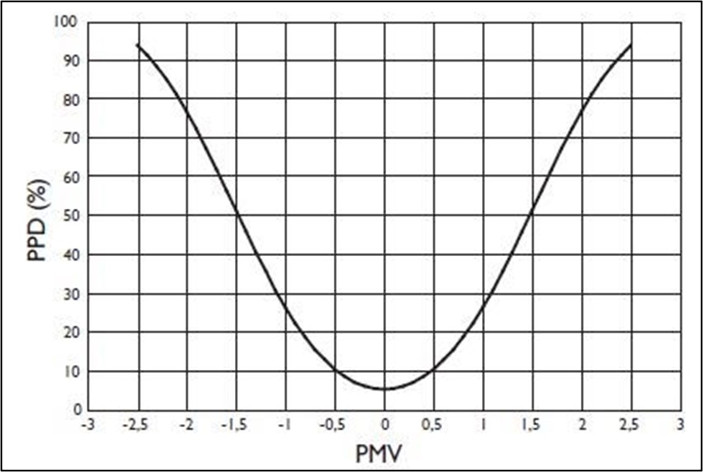
Figure 4 : example of a PMV/PPD diagram
The relationship between PMV and PPD provides for a minimum percentage of 5% dissatisfied for a vote equal to 0 (neutral feeling). In fact, in any configuration, there will always be dissatisfied people. The level of dissatisfaction naturally increases if the VMS moves towards cold or hot. To achieve a situation of overall thermal comfort, it is recommended that the predicted percentage of dissatisfied people (PPD) remains below 10%, which corresponds to a predicted average vote of between -0.5 and +0.5. In the design of real buildings, we’re not going to hold a vote among the staff! ISO standard 7730[vi] contains the variables used to determine comfort conditions, in particular: temperature, air speed, relative humidity, metabolism (intensity of physical activity), type of clothing, etc. By introducing these values, the standard enables PMV and PPD values to be calculated. Feelings are now quantified.
The adaptive method: our body adapts to the heat
In addition to our own reaction to heat, our body has a capacity to adapt. A sudden rise or fall in temperature is difficult for the human body to bear. On the other hand, a gradual rise in temperature is better accepted. This observation gave rise to the adaptive method, which is also used in most internationally recognised standards. It takes into account variations in climatic conditions over 7 sliding days. The adaptive method therefore stands out as a dynamic method, whereas the PMV/PPD method is characterised by a static approach. It is the adaptive method that has been chosen for RE 2020. The RE2020 engine performs a dynamic energy calculation, which takes into account the gradual adaptation of the human body to heat waves.
What tools can you use today to estimate thermal comfort?
« Perfection is a path, not an end”, says a Korean proverb. On this path[vii], we have a particularly ergonomic and relevant tool at our disposal: the one developed by the Center for the Built Environment at the University of California, Berkeley.. This tool is doubly advantageous: it allows us to visualise comfort zones using the most relevant standard to date, the American standard ASHRAE 55-2020, on the one hand, and the standard in force in the EU, EN-16798, on the other. With a very reasonable number of input parameters, we obtain a very sophisticated representation of summer comfort[viii].
How do I use ASHRAE-55, the US standard?
By accessing the Berkeley university website, you directly access the ASHRAE-55 tab. All you have to do is to enter the input data.
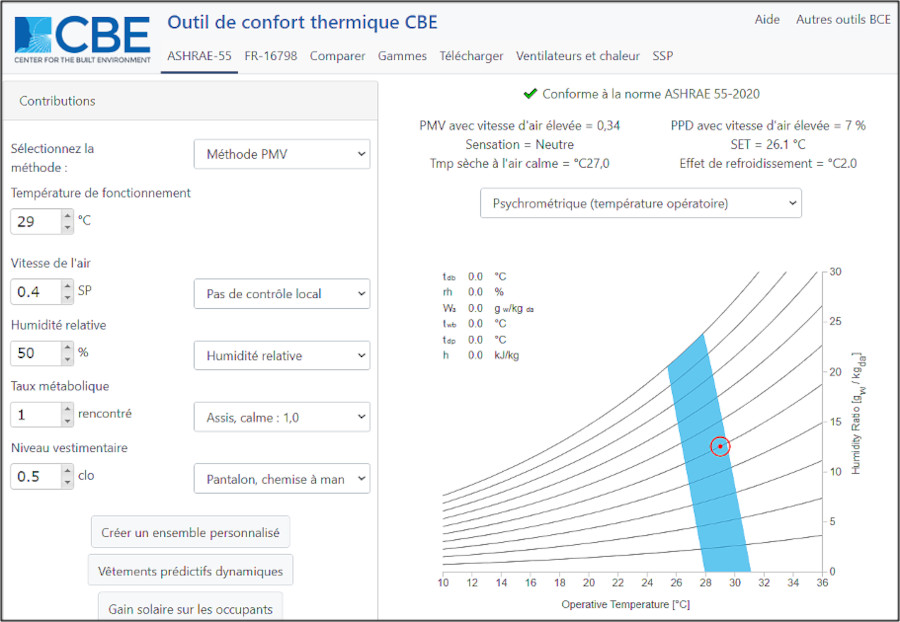
Figure 5 : summer comfort simulation using the CBE tool – ASHRAE-55 base – PMV method
Let’s now look at the parameters for ASHRAE-55[ix].
- Method: two approaches are possible, the PMV method and the adaptive method. The PMV method is suitable for air-conditioned buildings[x] (with the additional use of fans). This static method works well in a constant atmosphere, where temperature and humidity conditions remain stable. The adaptive, dynamic method, on the other hand, takes account of the body’s adaptation to temperature, and should be preferred for non-air-conditioned premises.
- Operating temperature: also known as the operating temperature, this is the average of the air temperature and the wall temperature. It should be noted that poorly insulated walls can radiate heat (for example, a wall facing west in the afternoon), and that this heat can generate discomfort. It should also be noted that ceiling fans with a wide area of influence will have a beneficial effect by balancing the air and wall temperatures. The value to be entered corresponds to your target temperature.
- Air speed: the value should be entered in m/s. You can use either an average speed in the room, or an average air speed that will be reached in the occupied zone.
- Relative humidity: in summer, this can generally be left at 50%.
- Metabolic rate: for situations involving occupancy in homes or offices, a value of 1.0 seems generally appropriate. It should be noted that situations of reduced metabolism (lying down, sleeping) can be calculated, but are outside the scope of the standard.
- Dress code: in the USA, you’ll often find summer outfits such as three-piece suits with long sleeves and air conditioning set at 19°C. But in Europe, it’s fortunately more common to dress more lightly (0.36-0.57).
- MCalculation method: we recommend “Psychrometric (operating temperature)”.
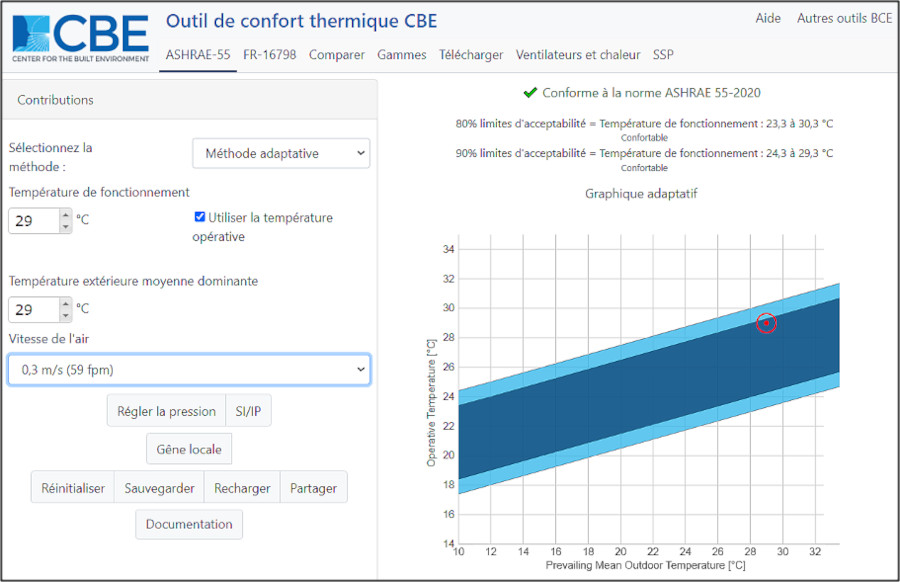
Figure 6 : simulation of summer comfort using the CBE tool – ASHRAE-55 basis – adaptive method
Also for ASHRAE-55, here are the elements to be taken into account in the adaptive method, bearing in mind that this method is suitable for sites without air conditioning
- Operating temperature: generally select the operating temperature
- Prevailing mean outdoor temperature: unless you have typical adiabatic cooling systems[xi], it seems logical to use the same basis as the operating temperature.
Air speed. This is the weak point of the adaptive method, which is less accurate than the PMV method. There are 4 possible values in m/s: 0.3; 0.6; 0.9 and 1.2. It should be noted that it is quite rare to obtain an average speed of 1.2 m/s over the whole body with a ceiling fan.
How to use European standard EN-16 798?
Just change tabs on the same site.
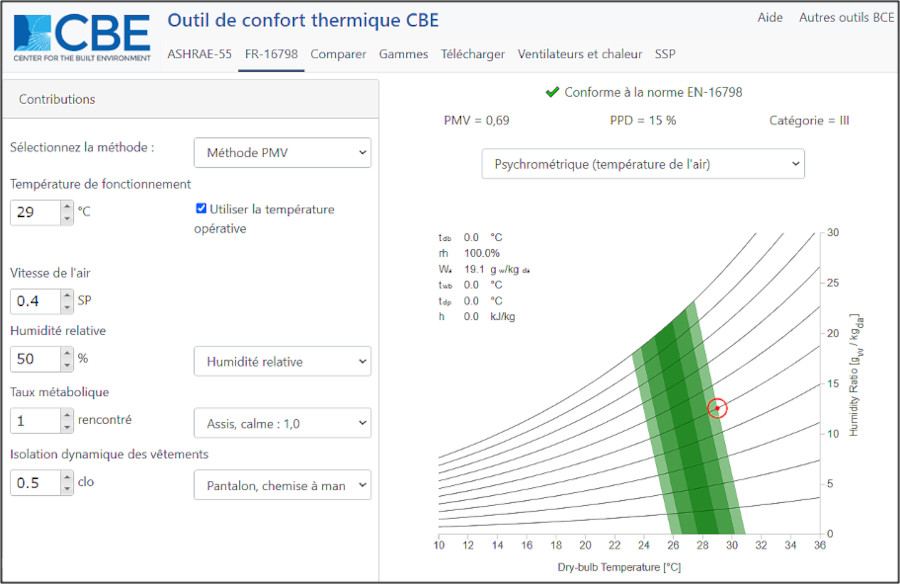
Figure 7 : summer comfort simulation using the CBE tool – based on EN 16798 – PMV method
The parameters to be entered are exactly the same as for ASHRAE-55, using the PMV method. All you have to do is tick the “use operating temperature” box. Graphically, whereas ASHRAE-55 gives a large blue zone, application of the European standard results in several parallel green bands, the forest green band being the optimum comfort zone. It should be noted, however, that at high temperatures (≥ 30°C), it is necessary to opt for light summer clothing before trying to increase air speed. As can be seen from the graph above, it is much easier to go beyond the EN 16798 standard than ASHRAE-55.
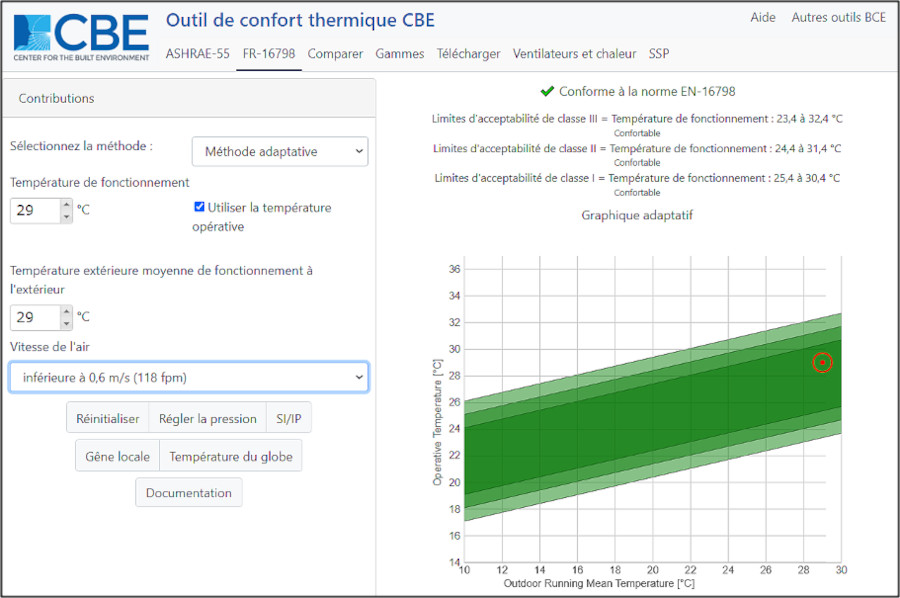
Figure 8 : simulation of summer comfort using the CBE tool – based on EN 16798 – Adaptive method
Finally, for the adaptive method in accordance with standard EN 16798, here are the elements to be taken into account, bearing in mind that this method is suitable for sites without air conditioning
- Operating temperature: generally use the operating temperature
- Prevailing mean outdoor temperature: unless you have adiabatic cooling type systems, it seems logical to use the same basis as the operating temperature.
- Air speed. The range of choices is even more limited than for ASHRAE-55, because we don’t have the value 0.3 m/s, just a value “less than 0.6 m/s”. Then there are the same 0.3 m/s steps, including the one corresponding to 1.2 m/s, which we feel is difficult to obtain in the field on average over the whole body…
Why quantify feelings?
Quantification of this kind has been possible since the middle of the last century, although progress is now being made. The quality of the interface developed by the University of California, Berkeley, is to be commended, as it makes it easy to use a tool based on the latest physiological and psychological knowledge[xii]. With these elements, designers have an essential building solution to improve the correct sizing of ceiling fans, and better satisfy the occupants of the premises who benefit from them.
[i] Flabellums are gradually becoming a pure symbol of power. Freshness is associated with power! [ii] The French title is broader than the English title, which suggests that it is only about fan engineering. In reality, the guide deals more generally with ventilation. The publisher of the book is a motor and propeller manufacturing company, now called Woods Air Movement. [iii] For a more detailed history of bioclimatic construction, see Clément Gaillard’s thesis, « Modulating the climate: the origins, development and significance of bioclimatic design in architecture (1947-1986) » [iv] The Givoni diagram or “climogram” shows the limits of the thermal comfort zone (pink), the zone of influence of ventilation at 0.5m/s (VV’ orange), thermal inertia (MM’ green), the zone of influence of evaporative cooling (EC and EC’ grey), and the zone of non-heating by passive solar design (H and H’ yellow). These elements come from the publication “le diagramme bioclimatique du bâtiment” by Jean-Louis IZARD and Olivier KACALA, available on EnviroBOITE. [v] The calibration was based on experimental studies on almost 1,300 subjects in climatic chambers. [vi] ISO 7730:2005 “Ergonomics of thermal environments – Analytical determination and interpretation of thermal comfort by calculating PMV and PPD indices and local thermal comfort criteria”. [vii] For those who want a high-quality background on the issue of summer comfort in buildings, we recommend the ICEB and ARENE Ile de France guide to passive summer comfort. [viii] This tool can be used with browsers that support French translation, such as Chrome, providing a user-friendly interface. [ix] The “local control” drop-down menu has no impact on the calculation for the time being. [x] For more details, see the EnergiePlus article on thermal comfort. [xi] Also known as evaporative cooling, adiabatic cooling is based on the principle that the temperature of hot, dry air that is humidified will drop. To evaporate, the water absorbs energy and therefore heat. [xii] On a national level, the BRASSE programme, funded by ADEME, will see its final report published in 2023. It will provide a better framework for the air velocity of ceiling-mounted air blowers. It involves 6 main entities: Surya consultants, the Laboratoire Piment at the University of La Réunion, EnvirobatBDM, the Eiffel laboratory, LASA (acoustics) and ISEA (social sciences).
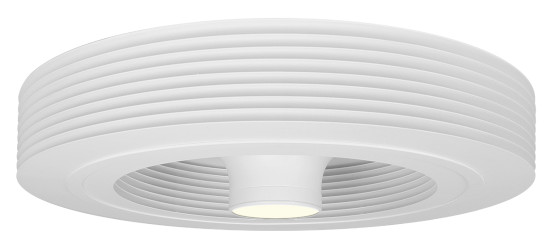
Exhale, the first vortex-effect ceiling fan without blades
Are you a professional? We have a dedicated area for you.
Find Exhale Fans Europe on Linkedin

